Online trading is the buying and selling of financial instruments through an authorised broker's platform or app, to profit from changes in their price. A trader opens a position with an order and closes it later, and the result is the price move in between, minus costs. In India, a resident trades with leverage only on Indian exchanges such as the National Stock Exchange of India (NSE) or on platforms authorised by the Reserve Bank of India (RBI), because the RBI does not allow residents to send margin to brokers or exchanges abroad. Trading is high risk, and most retail accounts trading CFDs lose money.
Trading differs from investing in its horizon. A trade lasts from seconds to weeks, while an investor holds an asset for years, for growth and for the income that ownership brings. The order that opens a trade once went by phone to a stockbroker, and online it goes from a platform or app. From the platform a trader reaches stocks, indices, forex, commodities, investment funds, bonds and cryptocurrencies. The easiest of these markets for a beginner are the large, liquid ones, such as the Nifty 50 and USD/INR. In each market the trader can own the asset outright or trade its price through a product. In most countries the CFD is the product closest to a beginner, but it is not open to Indian residents, because the RBI does not allow margin payments to the overseas brokers that offer CFDs: leveraged trading in India runs on Indian exchanges such as the NSE. A future carries leverage, which lets a margin of 11.3%, set by the exchange for that future through its clearing house, NSE Clearing, open a position 8.8 times larger. The broker computes profit and loss on that full position, not on the deposit.
Whatever the trading style, from scalping to position trading, a trader makes money when a position closes at a better price than it opened, long or short. The trader opens that position for a reason that analysis gives, never for a certainty. Costs come off every result, starting with the spread. The result most retail traders reach is a loss, and IG Markets, a broker in the UK, states that 68% of retail investor accounts lose money on its spread bets and CFDs. With leverage the loss grows with the full position, and a price gap can carry the loss past the deposit before the broker's close-out acts. The trader limits the risk of each trade before entering it, by deciding the most the trade may lose, setting the exit and sizing the position to match.
An Indian resident also trades with leverage under the margin rules of Indian exchanges such as the NSE: the RBI does not allow margin payments to brokers abroad, so the high leverage of offshore companies is not a permitted route. Negative balance protection is a rule for CFDs in the UK, the European Union and Australia, and it does not reach an Indian resident, because the RBI does not allow margin payments to the overseas brokers that offer CFDs. Tax also separates owning from speculating: in India, gains on shares bought outright and gains on derivatives listed on Indian exchanges are taxed as the Income-tax Act 2025 sets out.
A beginner starts by checking the broker, and the first check is authorisation, because a firm that fails it needs no further check. The beginner then practises without real money and learns the mechanics of a trade at no cost: the main Indian brokers offer no demo account with virtual money and live prices (as the help pages of Zerodha, Fyers and Dhan state), so practice runs on a demo version of the broker's platform with test data, where the broker has one, or on the paper trading of an external platform. Real money follows at small size, once the basics are solid. The conditions for that step are an emergency fund in place, only money that is truly spare, a budget set in advance and small enough to lose without real distress, and no history of problem gambling.
What is trading?
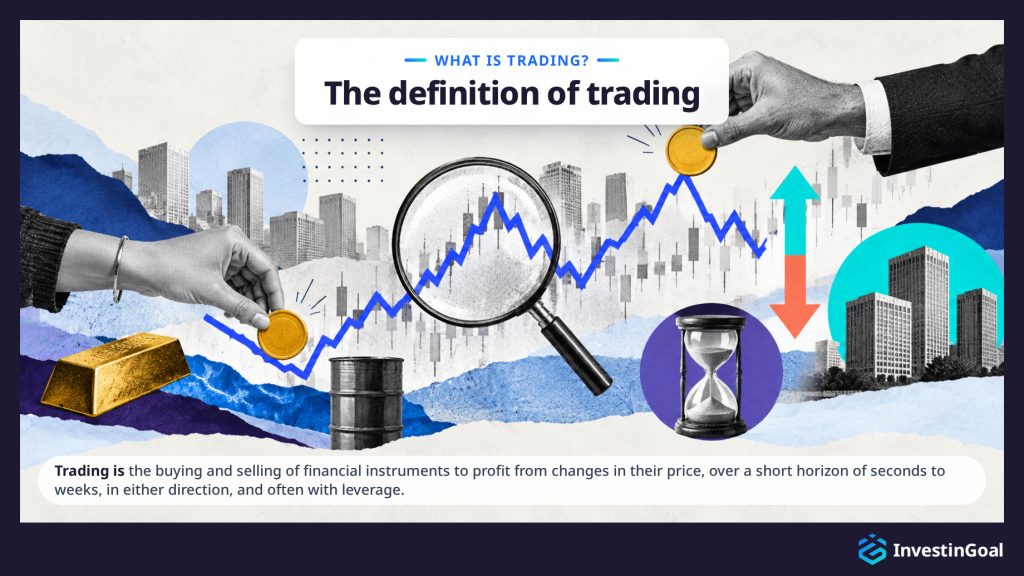
Trading is the buying and selling of financial instruments to profit from changes in their price, over a short horizon of seconds to weeks, in either direction, and often with leverage. A trader opens a position and later closes it, and the profit comes from the movement of the price, not from the income that owning an asset brings. Today a trader trades through an authorised broker's platform or app, whether that trader is a retail individual or an institution such as a bank or a fund.
The financial instruments that change hands are shares in companies, stock market indices, currencies, commodities such as gold and oil, investment funds, bonds and cryptocurrencies, either bought outright or traded through contracts that follow their price. A trader buys when they expect the price to rise and sells when they expect it to fall, so a falling market offers the same opportunity as a rising one. Leverage lets a small deposit control a larger position, and it magnifies both the gain and the loss on every move.
The same share can be traded or invested in, and a trader is the person or the firm that trades it: a retail individual trading their own money from a phone, or an institution, a bank or a fund, trading on a far larger scale. Retail traders and institutions meet in the same financial markets, at the same prices.
Two questions follow from the definition: how trading works, from the order sent on a platform to the close of the position, and how trading differs from investing, which uses the same instruments for a different purpose.
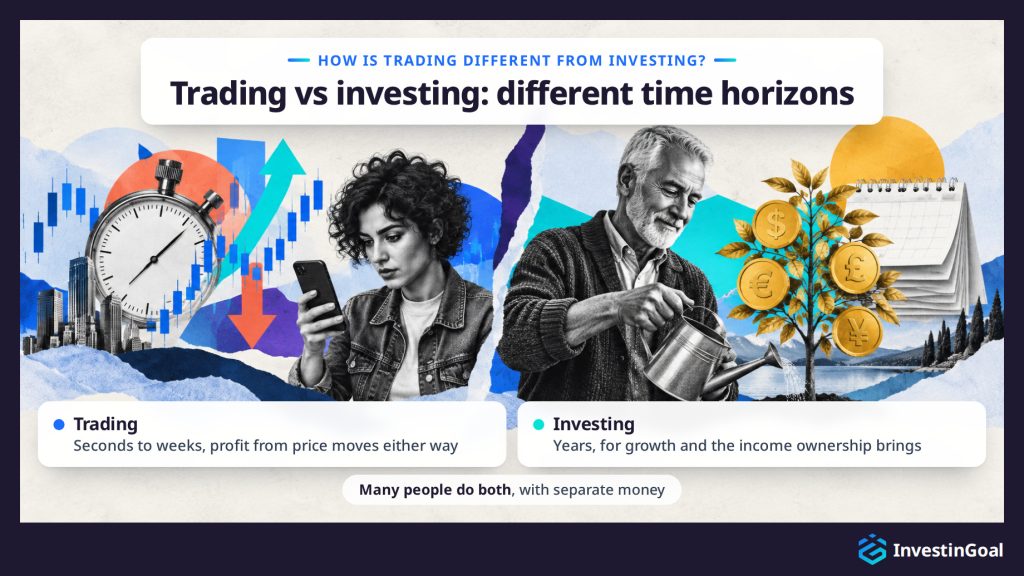
Trading is different from investing in its time horizon. Trading holds a position for seconds to weeks to profit from a price move, while investing holds an asset for years, usually in an investment account, for growth and for the income that ownership brings.
The horizon sets the frequency of decisions. A trader decides on every position, often several times a week, and watches the price while the position is open. An investor decides rarely, buys and holds for the long term, and lets years of growth and dividends do the work. The horizon also sets the direction. A trader can profit from a falling price by going short, while an investor gains only when the asset rises in value or pays income.
Trading often uses leverage, so a deposit controls a position several times its size. Investing usually pays the full price of the asset and owns it. An investor who owns a share receives its dividends, the share of profits a company pays to its shareholders, while a trader who holds a leveraged contract on the same share for two days receives only the change in its price. In return, trading has three advantages that investing lacks: the chance to profit in either direction, short holding times, and access to many markets from a single account.
Growth over years calls for investing, with the income that ownership brings. Profit from price moves in either direction calls for trading, at higher risk and with more of your time. Many people do both with separate money, and comparing trading and investing against your own goals decides how much of that money each activity gets.
Online trading is different from offline trading in how the order reaches the market. Offline, a phone call to a stockbroker or a floor trader carried the order, while online the trader sends it electronically from a platform or app. What did not change is that an authorised broker still stands between the trader and the market, and that the risk is the same.
In the UK, the change began on the London Stock Exchange with the Big Bang, the reforms that deregulated the City of London and ended fixed commissions on share deals. Share dealing moved from the trading floor to screens on 27 October 1986, and the floor emptied within months. Before the Big Bang, a private client phoned a stockbroker, the stockbroker passed the order to a dealer on the floor, and the price came back by phone. The screen reached private clients with the internet in the late 1990s, and their pocket with the smartphone. Online trading is also called electronic trading or e-trading.
Online trading brought the retail trader four advantages. Access: an account opens online, without a relationship with a stockbroker. Speed: an order reaches the market in a fraction of a second, and real-time prices update on a phone. Cost: the commission on a deal has fallen far below what a stockbroker charged by phone. Products and hours: a trading app offers shares, currencies, indices and commodities side by side, and quotes CFDs (contracts for difference, which follow a market's price without ownership of the asset) on many markets almost round the clock, well beyond the hours of any exchange.
The structure of a trade and its risk stayed the same. An authorised broker still holds the account and carries every order to the market, and a losing trade loses the same money whether the order went by phone in 1985 or by a tap on an app today. An app also makes it easier to trade more often, and trading more often is a risk of its own.
What markets can be traded?
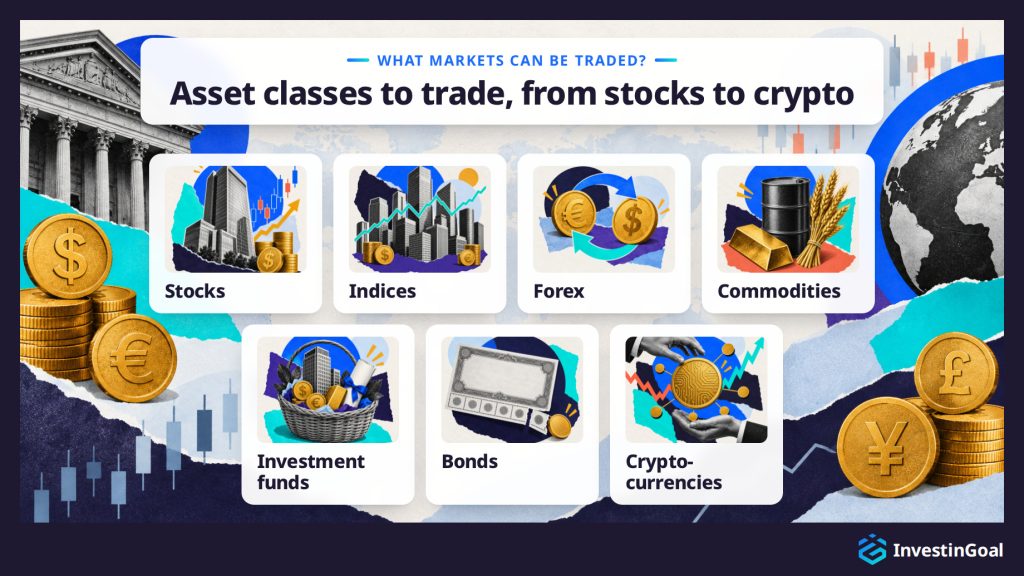
The seven markets that can be traded are listed below.
- Stocks: shares of companies listed on an exchange such as the National Stock Exchange of India (NSE), or the New York Stock Exchange (NYSE) and the Nasdaq, both in New York, open from 19:00 to 01:30 Indian time (IST) for most of the year, and one hour later from November to March, when New York is on standard time. A share's price moves with the company's results and with news about the company and its sector, and the shares of large companies trade in deep, liquid markets. Results days, when a company reports, are the days its share moves most, and the calendar of results shapes how stock trading works from week to week.
- Indices: a single price that tracks a basket of shares, such as the Nifty 50 for 50 large, liquid companies listed on the National Stock Exchange of India, the S&P 500 for 500 large US companies and the Germany 40, the name brokers give to Germany's DAX index, for 40 large German companies. An index moves with the economy, interest rates and the results of its largest members, and it usually moves less than a single share, because the basket dilutes one company's news.
- Forex: short for foreign exchange, currencies traded in pairs, such as USD/INR, the US dollar against the Indian rupee, and EUR/USD, the euro against the dollar. Forex is the largest market in the world, at $9.6 trillion a day according to the Bank for International Settlements' Triennial Survey of April 2025, and it is open 24 hours a day, five days a week. Forex prices move in pips, the fourth decimal place for most pairs, and positions are sized in lots, where a standard lot is 100,000 units of the first currency in the pair. Interest rates, inflation data and the decisions of central banks such as the Reserve Bank of India and the US Federal Reserve move a currency pair, and the major pairs are among the most liquid instruments a retail trader can reach, which is why forex trading for beginners usually starts with them.
- Commodities: physical goods of three kinds, metals such as gold and silver, energy such as oil and natural gas, and agricultural products such as wheat. Oil is quoted on two benchmarks, Brent crude from the North Sea and WTI (West Texas Intermediate) from the US. Their prices move with supply and demand, with geopolitics, which can cut the supply of oil or gas overnight, and with the US dollar, in which most commodities are priced. Gold and oil trade in liquid markets, agricultural products in thinner ones that also move with the weather, and physical supply weighs on every one of them, which sets it at the centre of how commodity trading works.
- Investment funds: baskets of shares, bonds or commodities whose price follows what they hold. ETFs are exchange-traded funds. They are listed on an exchange and traded like shares during the session, while mutual funds are priced once a day, which makes them better suited to investing than to trading.
- Bonds: loans to governments and companies that pay interest, such as Indian government securities (G-Secs), and corporate bonds. Bond prices move in the opposite direction to interest rates, and bonds are a market some traders use to trade their view on rates.
- Cryptocurrencies: digital currencies such as Bitcoin, the first and largest, and Ether, the currency of the Ethereum network, traded 24 hours a day, seven days a week, and far more volatile than shares or currencies. Access to crypto derivatives depends on the rules of each country, so crypto trading for beginners starts from what the rules allow where the trader lives.
Each of the seven markets is an asset class, a group of assets with similar traits that move with the same kinds of news.
The table below gives the seven markets, compared on the asset traded, examples and the main trait of each.
| Market | Traded asset | Examples | Main trait |
|---|---|---|---|
| Stocks | Shares of listed companies | NSE shares, NYSE and Nasdaq shares | Moves most on results days |
| Indices | One price for a basket of shares | the Nifty 50, S&P 500, Germany 40 | Usually moves less than one share |
| Forex | Currencies in pairs | USD/INR, EUR/USD | Largest market; open 24 hours, five days a week |
| Commodities | Physical goods | Gold, silver, Brent and WTI oil, natural gas, wheat | Mostly priced in US dollars |
| Investment funds | Baskets of shares, bonds or commodities | ETFs, mutual funds | ETFs trade in session; mutual funds priced daily |
| Bonds | Loans to governments and companies | Indian government securities (G-Secs), corporate bonds | Prices move opposite to interest rates |
| Cryptocurrencies | Digital currencies | Bitcoin, Ether | Open 24 hours, seven days a week; far more volatile |
The easiest markets for a beginner are the large, liquid ones, such as the Nifty 50, USD/INR and the shares of large companies. They are the easiest because their spreads are narrow, their prices are quoted continuously during their hours, and the news that moves them is widely reported. The spread is the gap between the price to buy and the price to sell.
Which products are used to trade?
The three products used to trade are listed below.
- CFDs: a contract for difference is an agreement with a broker that pays the difference between the opening and the closing price of a market, multiplied by the size of the position. A CFD is leveraged, can be opened long or short, and gives no ownership of the asset, and that combination is what CFD trading involves on every market, from a single share to an index.
- Futures: contracts traded on a futures exchange, such as ICE Futures Europe in London or the Chicago Mercantile Exchange (CME), to buy or sell a set quantity of an asset at a set price on a future date, with a fixed contract size and an expiry date. The exchange sets the size of each contract, often large, so the first figure to learn about what futures trading involves is how much one contract gains or loses for each point the price moves.
- Options: contracts that give the right, but not the obligation, to buy or to sell an asset at a set price by a set date, in exchange for a premium paid upfront. The buyer of an option risks only the premium, while the seller takes on the obligation and a much larger risk, a split that options trading for beginners has to cover before any strategy.
The other route to the same market is to own the asset: shares or ETFs bought outright through a broker account and held, with no product in between. Buying outright works long only and without leverage, and the asset belongs to the buyer. Owning the asset and trading its price through a CFD are therefore two routes to the same market, which differ in what each allows, costs and protects.
The table below gives the three products and buying outright, compared on what each one is, its main terms and the ownership it gives.
| Route | What it is | Main terms | Ownership |
|---|---|---|---|
| CFDs | Broker agreement paying the price difference | Leveraged; long or short | None |
| Futures | Exchange contract to buy or sell later | Set price, fixed size, expiry date | None |
| Options | Right, not obligation, to buy or sell | Set price and date; premium upfront | None |
| Buying outright | Shares or ETFs held in a broker account | Long only; no leverage | Asset belongs to the buyer |
CFDs are not open to Indian residents, so the leveraged product within reach of a beginner in India is a future listed on an Indian exchange such as the National Stock Exchange of India, and the size of its contract, which the exchange sets, is the first thing to learn. Options sit further from a beginner, because their pricing takes longer to learn than a future or a share. CFDs are leveraged products on which most retail accounts lose money.
Trading without owning the asset differs from buying it in ownership. A share bought outright makes the buyer a shareholder, with shareholder rights and dividends, while a future on the same share, listed on an Indian exchange such as the National Stock Exchange of India (NSE), pays the change in its price and gives none of those rights. In exchange, the future allows going short and trading with leverage, and ownership allows neither. A future charges no overnight financing: the cost of holding the position is built into its price, and the contract expires on a set date.
Take ₹4,50,223 of exposure to one share, which is one lot of the future on a share, of 650 shares, as the exchange sets it through NSE Clearing. Bought outright, the same number of shares costs ₹4,50,223 plus the broker's commission, and the full amount leaves the account. Through the future, with the margin that the exchange sets for it, 17.7%, which is leverage of 5.6:1, the same exposure needs ₹79,689 deposited. A 10% fall in the share costs ₹45,022 in both cases: for the owner, a tenth of the money invested; for the trader holding the future, about 56% of the deposit. Only the trader holding the future could have sold first and gained ₹45,022 from the same fall.
The two routes also differ in costs, tax and protections. The owner pays the commission once, on the purchase, and no daily charge while holding the share. The future trader pays the spread and the commission, and no overnight financing, but the contract expires: holding the position for months means rolling it over to the next contract before each expiry, paying the spread and the commission again, along with the cost of holding built into the price of each new contract. The two products are taxed differently, and the treatment depends on the country. For a broker on an Indian exchange, the cover if the broker fails is the Investor Protection Fund of the exchange, up to ₹3,500,000 per investor, and it never extends to trading losses; negative balance protection is a rule for CFDs in the UK, the European Union and Australia, and it does not reach an Indian resident, because the Reserve Bank of India does not allow margin payments to the overseas brokers that offer CFDs.
Holding for years calls for buying the asset. Trading short-term moves in either direction calls for a leveraged product, which for an Indian resident means a derivative listed on an Indian exchange such as the NSE, chosen with the knowledge that leverage magnifies the loss as much as the gain.
How does trading work?
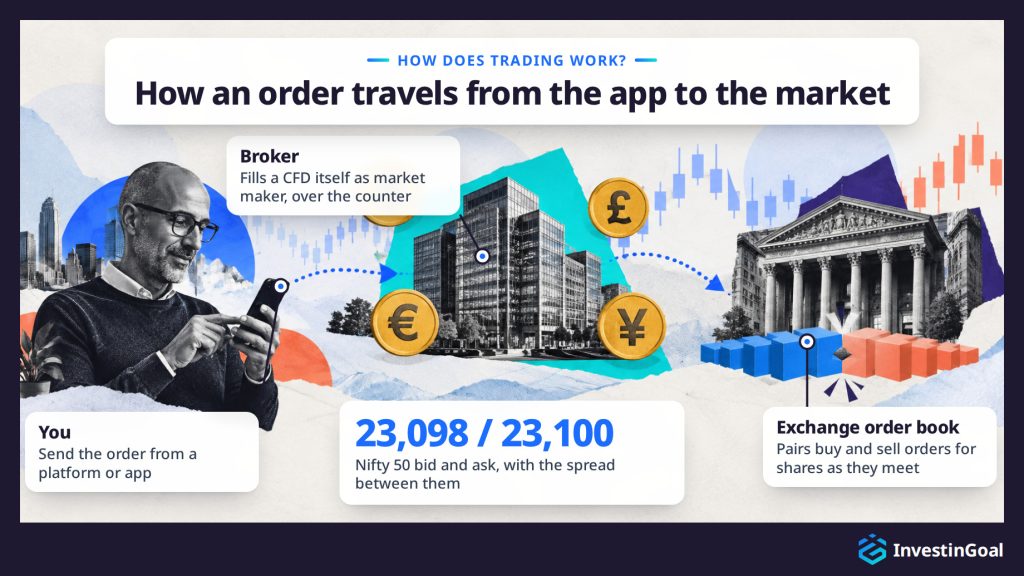
Trading works by sending an order from a platform or app to a broker, which either matches it on an exchange's order book or fills it itself as market maker, over the counter. A buy fills at the ask price and a sell at the bid price, prices move with supply and demand, and the position stays open until an opposite order closes it.
A broker quotes every market with two prices. The bid is the price at which you can sell, the ask is the price at which you can buy, and the gap between them is the spread, the first cost of every trade. A quote on the Nifty 50 might read 23,098 / 23,100. You sell at 23,098 and buy at 23,100, and a position bought at 23,100 starts 2 points down, because selling it at once would fill at 23,098.
The route of the order depends on the product. A share bought outright goes to an exchange such as the National Stock Exchange of India, where the order book lists the buy and sell orders at each price and pairs them as they meet. A CFD is traded over the counter. Over the counter, the broker acts as market maker, quotes its own bid and ask from the price of the underlying market, and takes the other side of the trade.
Prices move with supply and demand. When buyers are more urgent than sellers, they accept higher prices and lift the ask. When sellers are more urgent, they accept lower prices and hit the bid. The buyers and sellers are the other traders, retail individuals and institutions such as banks and funds, whose combined orders make the price. A trade therefore involves you, the broker, and either the exchange where your order meets another trader's or the market maker that takes it.
The position then stays open, gaining or losing with every move of the price, until an opposite order closes it. A sale closes a purchase, and a purchase closes a sale. Three links in the chain decide most of the result: the broker that carries the order, the leverage that sizes the position, and the orders that open and close it.
Online trading goes through a broker because a retail client cannot deal on an exchange directly. An online broker is the authorised firm that opens the client's trading account, holds the money in it, provides the platform and executes each order, either by passing it to an exchange or by taking the other side of the trade as market maker.
Only member firms can deal on an exchange, and membership requires capital, systems and supervision that an individual does not have. The broker is authorised in India, where a resident trades with leverage only on Indian exchanges such as the National Stock Exchange of India or on platforms authorised by the Reserve Bank of India (RBI), because the RBI does not allow residents to send margin to brokers or exchanges abroad, and the authorisation is what allows the broker to hold retail clients' money and carry their orders. Opening an account starts with identity checks, known as KYC (know your customer), which the law requires against fraud and money laundering. The firm then keeps client money segregated from its own, in separate accounts, so that the firm's creditors cannot claim it if the firm fails.
Execution follows one of two models, and each shapes the price the client gets. In the first, the broker passes the order to an exchange, and the client gets the exchange's price, usually plus a commission. In the second, the broker is the market maker. The broker quotes the price, takes the other side of the trade and earns from the spread, so the client's price is the broker's own quote, derived from the underlying market. Many firms run both models, shares through the exchange and CFDs as market maker, and even the best online brokers execute every order through one of the two.
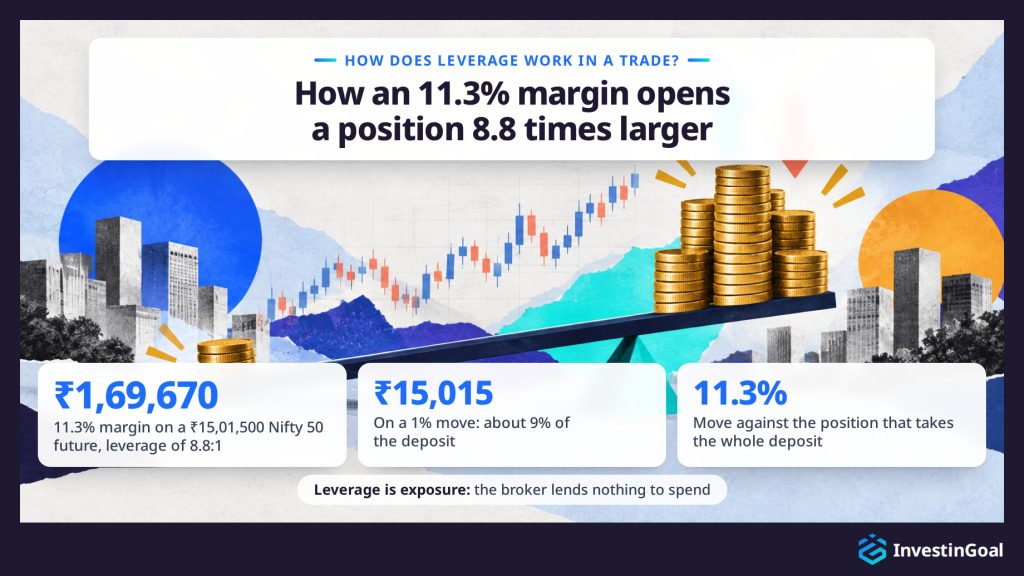
Leverage works in a trade by letting a deposit, the margin, open a position many times larger, so that the broker computes profit and loss on the full position and not on the deposit. On a lot of the future on the Nifty 50, 65 units of the index worth ₹15,01,500, an 11.3% margin, as the exchange sets it for that future through NSE Clearing, means ₹1,69,670 deposited, which is leverage of 8.8:1. A 1% move in the index gains or loses ₹15,015, about 9% of the deposit.
Margin and leverage express the same ratio. A margin of 5% means a position 20 times the deposit, 20:1. A margin of 3.33% is 30:1, and a margin of 20% is 5:1. The broker lends the trader nothing to spend. Leverage is exposure, and the trader carries the gain or the loss on the whole ₹15,01,500.
With the Nifty 50 at 23,100, a spread of 2 points is about 0.0087% of the price, about ₹130 on a ₹15,01,500 position, and it comes off both outcomes. A 1% rise gains ₹15,015 and leaves ₹14,885 after the spread. A 1% fall loses ₹15,015 and costs ₹15,145 with the spread. An 11.3% move against the position takes ₹1,69,670, the whole deposit.
As losses eat into the account, the broker watches the equity, the deposit plus or minus the open result. When the equity runs short of the margin the position requires, a margin call warns the trader to add money or reduce the position, and if the equity keeps falling the broker closes positions before the account runs dry. The margin call and the close-out are the two safeguards built into how leverage works, and neither changes the arithmetic. Leverage itself has a limit for an Indian resident in the margin rules of Indian exchanges such as the National Stock Exchange of India: the Reserve Bank of India does not allow margin payments to brokers abroad, so the high leverage of offshore companies is not a permitted route.
The four orders that open and close a trade are listed below.
- Market order: fills now, at the best price available, so a buy fills at the ask and a sell at the bid. The fill is certain and the price is not, and in a fast market the price can be worse than the one on the screen.
- Limit order: fills at the price you set or better, a buy at or below the limit and a sell at or above it. The price is certain and the fill is not, because the order never fills if the market never reaches the limit.
- Stop-loss order: closes the position when the price reaches a set loss level. A stop-loss is not guaranteed, because the order fills at the next available price when the price gaps through the level, overnight or on news. That price can be well beyond the level. Guaranteed stops close exactly at the level, and some brokers offer them for a premium.
- Take-profit order: closes the position when the price reaches the target, locking in the gain without the trader watching the screen.
What are the main trading styles?
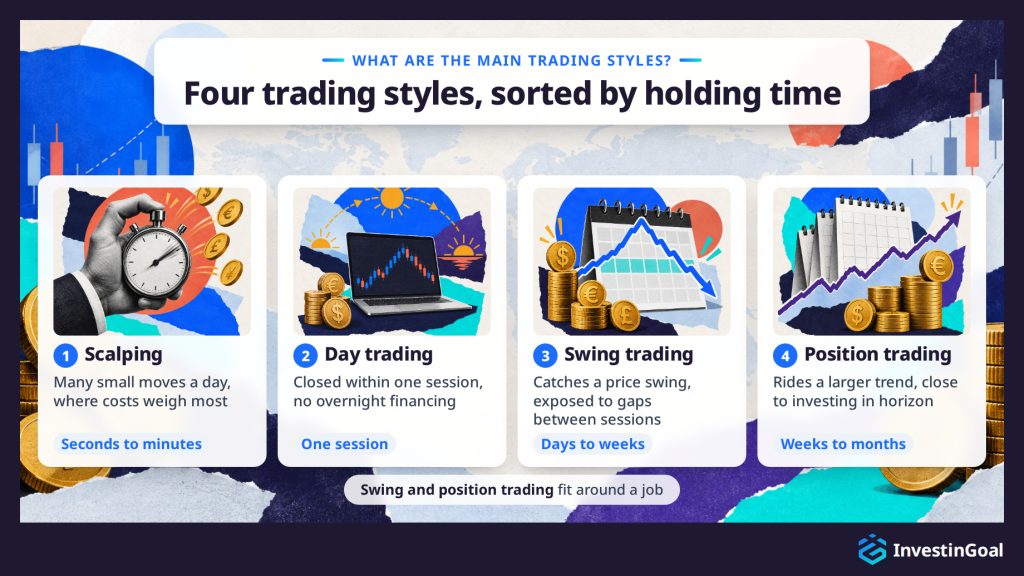
What defines the four main trading styles is how long a trader holds a position. They are listed below from the shortest holding time to the longest.
- Scalping: positions held for seconds to minutes, many times a day, to catch small moves. Costs weigh most in scalping, because the trader pays the spread on every trade and each gain is small.
- Day trading: positions opened and closed within one session, so the trader holds none overnight. Day trading needs hours at the screen while the market is open.
- Swing trading: positions held for days to weeks to catch a swing in the price. A future pays no overnight financing, because the cost of holding the position is built into its price, and the price can gap between sessions.
- Position trading: positions held for weeks to months on a larger trend, close to investing in horizon but still aimed at the price move. A future held for months has to be rolled over to the next contract before each expiry, and the spread and the commission paid at each rollover add up over the months, along with the cost of holding built into the price of each new contract.
A style is the time frame, and a strategy is the set of rules inside it: when to enter, where to exit and how much to risk. Common trading strategies include trend following, which trades in the direction of the trend, breakout trading, which enters when the price leaves a range, and range trading, which buys near the bottom of a range and sells near the top. Algorithmic trading sits on a different axis, because it describes who executes the trades, software following written rules, and an algorithm can scalp or hold for weeks. Swing trading and position trading need checking only once or twice a day, which makes them the styles that fit around a job, while scalping and day trading take the working hours themselves. Holding time is the axis that sorts the main types of trading, and the same market can be traded in any of the four styles.
How do you make money from trading?
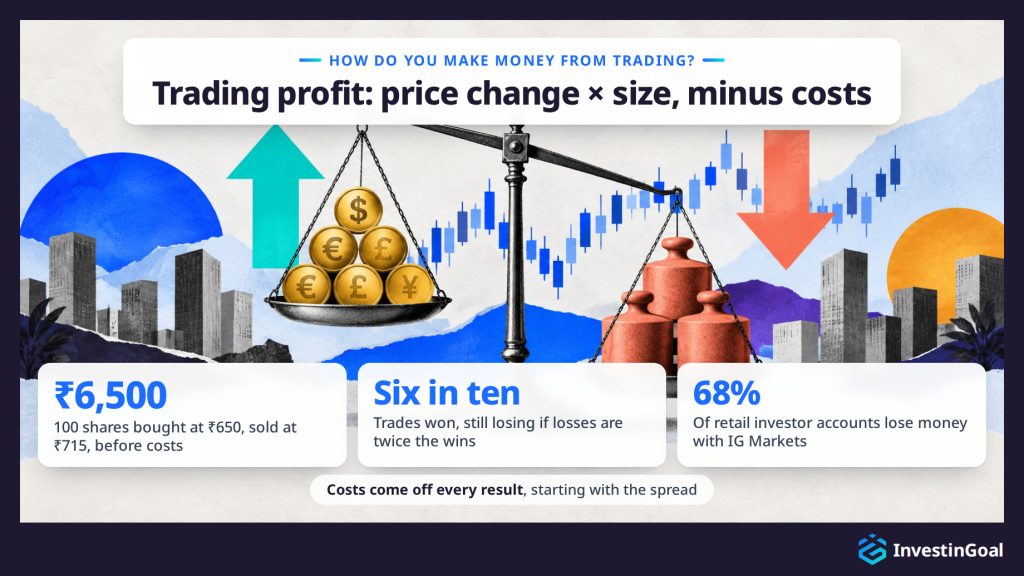
You make money from trading when a position closes at a better price than it opened. A long position buys and then sells higher, and a short position sells and then buys back lower. The profit or loss equals the price change times the position size, minus costs, and over many trades the result depends on the size of the wins against the losses.
Take 100 shares bought at ₹650, a position of ₹65,000. Sold at ₹715, the position gains ₹65.00 × 100 = ₹6,500. Sold at ₹585, it loses ₹6,500, both before costs. The same move made short, selling 100 shares at ₹650 and buying them back at ₹585, gains ₹6,500. The calculation multiplies the price change by the position size, never by the deposit. The deposit may be a fraction of the ₹65,000 with leverage, and the gain or the loss is still ₹6,500.
Costs come off every result, starting with the spread, which the position crosses the moment it opens. A trade has to move further than its costs before it shows a profit, so a method that wins small and often can lose money once the trader has paid the spread and the other charges.
Over many trades, how often a trader is right matters less than how much the wins make against how much the losses cost. A trader who wins six trades in ten still loses money if each loss is twice the size of each win.
The result most retail traders reach is a loss. That loss shows in a figure that firms offering CFDs publish, the share of their retail accounts that lose money. IG Markets is a UK provider of spread bets and CFDs, and on its UK guide dated 13 July 2026 it stated, for example, that 68% of retail investor accounts lose money when trading spread bets and CFDs with the firm. A living from trading exists, but a minority reaches it, after years of practice and with an account large enough for normal gains to cover the cost of living. Persistence alone does not get there. The economists Fernando Chague, Rodrigo De-Losso and Bruno Giovannetti followed the 19,646 people who began day trading futures on the Ibovespa, Brazil's main stock index, between 2013 and 2015, and found that 97% of those who kept going for more than 300 days lost money.
Which kinds of analysis guide a trade?
The three kinds of analysis that guide a trade are listed below.
- Technical analysis: studies the price itself on charts, with its trends, the volume traded, the support and resistance levels where the price has turned before, and indicators calculated from past prices, such as moving averages and the Relative Strength Index (RSI). Technical analysis assumes that the way a market has moved says something about how it will move next.
- Fundamental analysis: studies what should drive the value of an asset, such as a company's results, economic data like inflation and employment, and interest rates, which the Reserve Bank of India sets for India. A rate decision can move the Indian rupee, the Nifty 50 and Indian government securities (G-Secs) within seconds.
- Sentiment analysis: studies the positioning and the flows of the other participants, how traders are placed and how crowded one side of a market has become. Its data come from sources such as the weekly Commitments of Traders report, in which the US Commodity Futures Trading Commission (CFTC) shows how the large participants in futures markets are placed, and the share of clients long or short that many brokers publish. Sentiment analysis reads a crowded side as a warning, because few buyers are left to push a price higher once most traders already hold it.
The table below gives the three kinds of analysis, compared on what each one studies, its typical tools and data, and how it reads the market.
| Analysis | What it studies | Typical tools and data | How it reads the market |
|---|---|---|---|
| Technical | The price on charts | Trends, volume, support and resistance, moving averages, RSI | Past moves say something about the next |
| Fundamental | What drives an asset's value | Company results, inflation, employment, interest rates | Results, data and rate decisions move prices |
| Sentiment | Other participants' positioning and flows | Commitments of Traders report; brokers' long/short shares | A crowded side is a warning |
Most traders combine the three kinds of analysis, using fundamentals for the reason to trade and the chart for the timing. Past performance is not a reliable indicator of future results, whether the past is a chart, a strategy's record or your own run of trades.
Interpreting chart patterns in trading involves analysing the shape and context of price formations to infer what they suggest about future price direction. Traders interpret chart patterns in terms of who is in control (buyers or sellers), likely breakout direction, and potential price targets. Chart pattern interpretation is about understanding what the shape of price movement suggests regarding trend changes or continuations, and acting on those insights. Traders translate the visual pattern into a trading plan, where they identify a pattern, wait for completion/confirmation, and then enter and manage the trade by reading what the pattern implies for stop and target.
Chart pattern interpretation is a mix of technical guidelines and some art, since experience helps in distinguishing high-probability patterns from false ones and reading context (patterns in the context of larger trends or other signals). Traders get a feel for which patterns to trust and how aggressively to trade them with practice.
Volume behaviour is part of chart pattern interpretation. Many patterns are considered more reliable if accompanied by certain volume patterns. For example, in a head and shoulders, volume often is highest on the left shoulder and head, then diminishes, and spikes on the break of the neckline. A trader seeing volume spike on the neckline break interprets that as confirming heavy selling and thus a valid reversal. In a flag, declining volume during the flag formation and then increasing on breakout is a classic sign that the continuation is real. Many traders devote many hours of study to a perfect understanding of chart patterns in trading and their rules.
Interpreting candlestick patterns in trading involves analysing the shape and position of one or several candlesticks to infer the market's current sentiment and potential next moves. Traders look at where a candlestick pattern occurs (after an uptrend, downtrend, or in a consolidation) and what the pattern signifies about buyer-seller dynamics, then use that information to make trading decisions.
Candlestick pattern interpretation is about reading the story each pattern tells about who's winning between bulls and bears, and then making a probabilistic bet that this story will continue to unfold in the indicated direction. By combining knowledge of patterns (knowing the exact rules of the "shooting star", for example) with placement (it happened at a resistance level after a long rally), traders make decisions to buy, sell, or stand aside. Candlestick patterns distil a lot of price info into a compact signal. Traders anticipate short-term market moves and adjust their positions accordingly by interpreting candlestick patterns accurately, ideally with confirmation signals such as volume increases.
Candlestick patterns are interpreted within a broader market context, whether in an uptrend, downtrend, or range. In downtrends, patterns such as the Hammer or Morning Star suggest a bullish reversal, while in uptrends, formations like the Shooting Star or Evening Star warn of a potential top. Multi-candle patterns (for example, Bullish Engulfing or Bearish Engulfing) emphasise momentum shifts from sellers to buyers or vice versa.
Traders often seek confirmation through follow-up candles, volume analysis, or alignment with key support and resistance levels. Higher time frames (daily or weekly charts) typically lend more weight to these patterns than shorter intervals.
What are the costs of online trading?
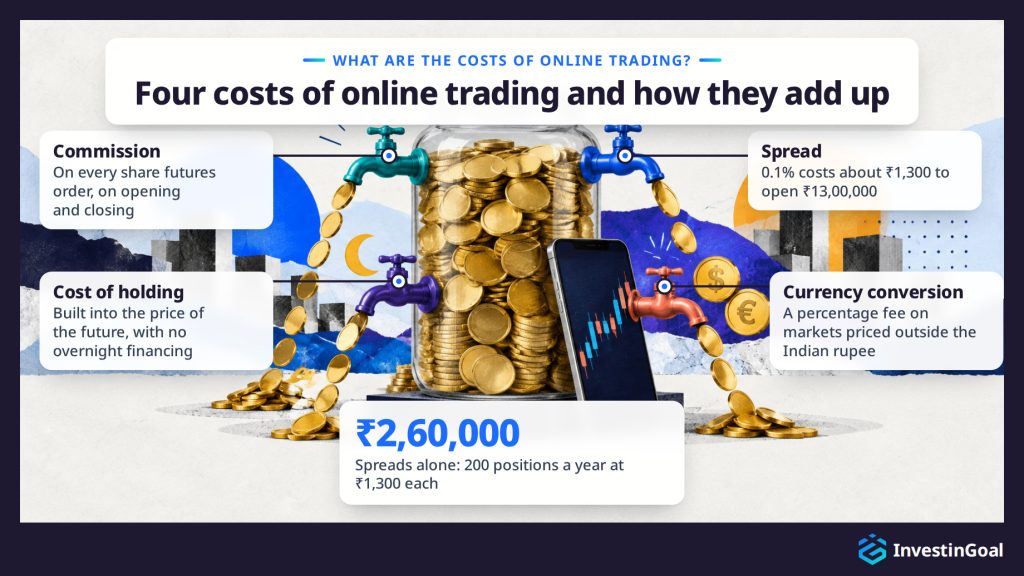
The four costs of online trading are listed below.
- Spread: the gap between the buy and the sell price, paid on opening because a position opens at the ask and would close at the bid. On a ₹13,00,000 position, a spread of 0.1% costs about ₹1,300 to open. No line on a statement shows the spread, because the cost sits inside the two prices, and that is the practical meaning of a spread for a trader: a charge paid on every trade without being billed.
- Commission: a fee the broker charges on top of the price. Buying shares outright usually costs a flat fee per deal, while share futures carry a commission on every order, charged when the position opens and again when it closes.
- Cost of holding: a future charges no overnight financing, because the cost of holding the position is built into its price, which differs from the price of the underlying market until the contract expires. Holding past expiry means rolling over to the next contract, and paying the spread and the commission again.
- Currency conversion: a percentage fee on markets priced outside the Indian rupee, such as US shares in dollars, charged when the broker converts the money and again when the result comes back to the Indian rupee.
The table below gives the four costs, compared on what each one applies to, how it is calculated and when it is charged.
| Charge | Applies to | How it is calculated | When it is charged |
|---|---|---|---|
| Spread | Every trade | Buy-sell gap; 0.1% is about ₹1,300 on ₹13,00,000 | On opening |
| Commission | Shares bought outright; share futures | Flat fee per deal; a commission on every futures order | Per deal; share futures on opening and closing |
| Cost of holding | Futures held open | Built into the price of the future; the spread and the commission are paid again at each rollover | At each rollover |
| Currency conversion | Markets priced outside the Indian rupee | Percentage fee | On conversion and on return to the Indian rupee |
Each charge is small on one trade and adds up with frequency. A trader who opens 200 positions a year at a spread of ₹1,300 each pays ₹2,60,000 in spreads alone, a cost the trades have to earn back before any profit.
What are the risks of trading?
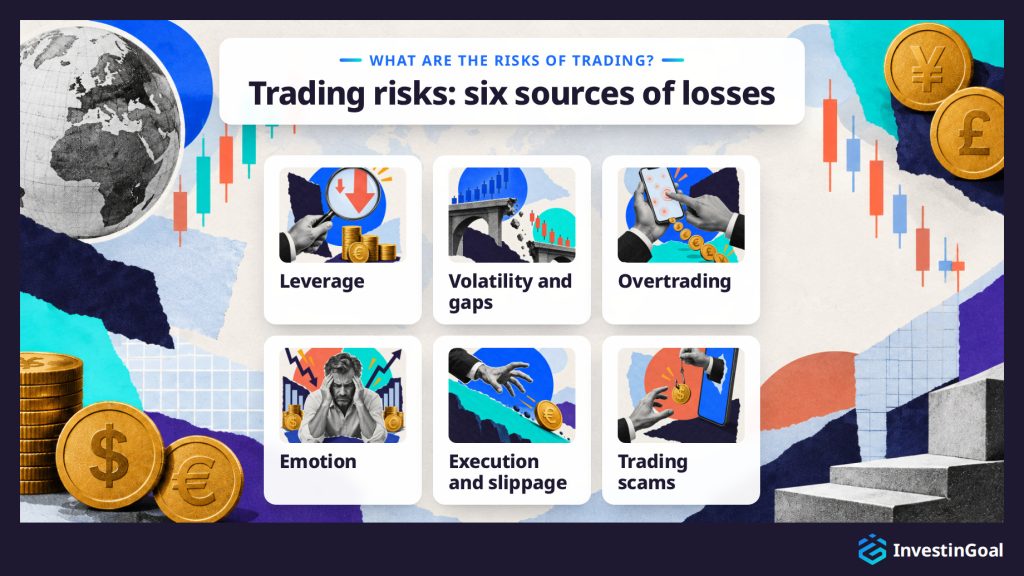
The six sources of trading losses are listed below.
- Leverage: a loss grows with the full position, not with the deposit, so a 5% move against a position at 20:1 takes the whole margin.
- Volatility and gaps: prices jump on news, a company's results and economic data, and across the hours a market is closed. A price that opens far from the previous close skips every level in between, a stop-loss included. On 15 January 2015, the Swiss National Bank dropped without warning its floor of 1.20 Swiss francs per euro, and the franc rose by more than 30% against the euro at the height of the move, before ending the day about 15% higher.
- Overtrading: trading more often raises costs and lowers results. Brad Barber and Terrance Odean, in Trading Is Hazardous to Your Wealth (Journal of Finance, 2000), studied the brokerage accounts of US households from 1991 to 1996 and found that the households that traded most earned 11.4% a year, against 17.9% for the market.
- Emotion: fear and greed break the plan, most often after losses, when a trader raises the size to win the money back or holds a losing position in the hope that the price returns. Terrance Odean found the second habit in the records of 10,000 accounts at a large US discount broker from 1987 to 1993 (Journal of Finance, 1998). The investors showed a strong preference for selling their winning shares rather than their losing ones, a pattern known as the disposition effect. Trading psychology is the study of these reactions, and of the discipline that keeps them out of the plan.
- Execution and slippage: in fast markets an order fills at a worse price than intended. That difference is slippage, and it comes off the result.
- Trading scams: unauthorised firms, clone firms that copy the name of an authorised one, tips on social media and promises of guaranteed returns take beginners' money without a single trade. The FCA, the financial authority of the UK, received 14,504 reports of unauthorised business from January to August 2024, and checking every firm against the regulator's register and warning list is the first rule of how to spot trading scams.
Yes, trading losses can exceed the amount invested on a leveraged position, because the loss grows with the full position and a price gap can carry it past the deposit before the broker's close-out acts. Negative balance protection, which exists precisely because the loss can pass the deposit, and which stops the loss at the money in the account, is a rule for CFDs in the UK, the European Union and Australia, and it does not reach an Indian resident, because the Reserve Bank of India does not allow margin payments to the overseas brokers that offer CFDs.
On a ₹13,00,000 position held with ₹65,000 of margin, a 5% fall takes the whole deposit. A 10% gap overnight takes ₹1,30,000, twice the deposit, whether it comes from a company's results or a political shock, and the broker's close-out cannot act at a price the market skipped. A stop-loss does not cap the loss in a gap either, because the stop fills at the next available price.
Negative balance protection moves the loss beyond zero from the client to the broker. When the account falls below zero, the broker writes off the negative balance. In the UK, the European Union and Australia a retail client's loss on CFDs stops at the money in the account, and the rule does not reach an Indian resident. The protection belongs to retail clients only, and it covers the account, not a single trade, so the whole balance of the account can still be lost.
The risk of a trade is limited by three decisions the trader takes before entering it. The trader first decides the most the trade may lose. The trader then sets the exit at the price where the market proves the idea wrong. Last, the trader sizes the position so that the loss at that exit equals the amount decided. Position size therefore equals risk divided by the distance from entry to exit.
The loss of any trade is its size times the distance from the entry to the exit. The risk comes first, usually 0.5% to 1% of the account per trade. The exit comes next, at the price where the reason for the trade no longer holds. The size follows from the two. A wider stop means a smaller position, so the loss stays at the amount decided whatever the market.
A stop-loss order closes the position at the exit, except in a gap, where the order fills at the next available price. A target at least twice the distance to the stop makes each win worth at least two losses, so a trader who wins fewer than half of the trades can still come out ahead.
Limits above the single trade protect the account over a run of losses. Over such a run the account falls from its peak, and that fall is the drawdown. To cap the drawdown, a daily or weekly loss limit stops trading once the account has lost a set amount. A second limit is diversification, the spreading of risk across several positions and markets, which restricts how much one trade or one market can hurt the account. The limits on each trade and on the whole account together make up risk management.
A trading plan writes all of these limits down before the first trade: the markets, the reason to enter, the risk per trade, the stop and the target, and the loss limits. The common ways beginners lose money come from leaving these limits unset.
What is different about online trading in India?
What is different about online trading in India is that residents may trade with leverage only on Indian exchanges and on platforms authorised by the Reserve Bank of India (RBI), which does not allow margin payments to brokers abroad, and the taxes that separate the ways to trade. A trader in India checks that the broker is a member of an Indian exchange and that the platform is not on the alert list of the RBI. The markets, buying outright and futures listed in India, the mechanism of a trade and its costs work as everywhere else.
A trader in India owns assets or speculates with derivatives listed on Indian exchanges, pays the same kinds of charges and follows the same chain from the order to the close; CFDs, which overseas brokers offer, are not open to residents.
The frame around those routes is what changes. In India, a resident trades with leverage only on Indian exchanges such as the National Stock Exchange of India (NSE) or on platforms authorised by the RBI, which does not allow residents to send margin to brokers or exchanges abroad. The margin rules of Indian exchanges such as the NSE limit leveraged products for an Indian resident, and the high leverage of offshore companies is not a permitted route. In India, gains on shares bought outright and gains on derivatives listed on Indian exchanges are taxed as the Income-tax Act 2025 sets out.
In India, leveraged trading is regulated through Indian exchanges and the Reserve Bank of India (RBI): residents may trade forex only with authorised entities, on Indian exchanges such as the National Stock Exchange of India (NSE) or on platforms that the RBI authorises, and may not send margin to brokers or exchanges abroad. The RBI publishes an alert list of unauthorised platforms, which includes well-known CFD brokers. Every firm that deals with residents of India with leverage must trade on an Indian exchange such as the NSE or on a platform authorised by the RBI, keep client money segregated and apply the margin rules of the exchange on leveraged products. For a broker on an Indian exchange, the cover if the broker fails is the Investor Protection Fund of the exchange, up to ₹3,500,000 per investor, and it never extends to trading losses.
A firm that wants to deal with residents of India with leverage joins an Indian exchange such as the NSE, or has its platform authorised by the RBI, which check its capital, its systems and the people who run it before granting permission, and then supervise it. A member firm appears in the public list of members of the exchange, with its permissions, its address, its website and its phone number. Once a member, the firm must keep client money in segregated accounts and apply the margin rules of the exchange on leveraged products. For a broker on an Indian exchange, the cover if the broker fails is the Investor Protection Fund of the exchange, up to ₹3,500,000 per investor, and it never extends to trading losses.
The RBI also keeps an alert list of unauthorised platforms. Clone firms copy the name, reference number or website of an authorised firm to take deposits from people who believe they are dealing with the real one.
The check before depositing takes a few minutes. Check that the broker is a member of an Indian exchange, confirm that the website and the phone number match the ones you were given, and search the alert list of the RBI for the same name. A firm that is not a member of an exchange, or whose details do not match, should receive no money. The check of the membership and the alert list is the part of what trading regulation involves that falls to the reader rather than to the firm.
For an Indian resident, the limits on leveraged trading are the margin rules that Indian exchanges such as the National Stock Exchange of India set on their derivatives (for the NSE, through NSE Clearing), listed below. The leverage caps, negative balance protection and close-out rules of overseas companies do not apply, because the Reserve Bank of India does not allow residents to send margin to brokers abroad.
- Initial margin: the deposit that each position requires, which the exchange sets for each contract as a percentage of the value of the contract, made of a risk margin computed with the SPAN system and an extreme loss margin.
- Changes with volatility: the margin changes with the volatility of the market, so the margin of a contract is a value on the date of the facts and not a fixed number, because the SPAN scanning range follows daily volatility, with a floor of 9.3% of the price for index derivatives and 14.2% for share derivatives.
- Lot size: the size of one lot, which the exchange sets, and with it the margin of one lot, the minimum needed to trade a future, under a SEBI rule that keeps the value of an index contract between ₹15 lakh and ₹20 lakh (1 lakh is 100,000) at each revision of the lot.
The table below gives three contracts of Indian exchanges, compared on their margin and their leverage (indicative values on 30 October 2026, based on the margin parameters of NSE Clearing).
| Contract | Margin | Leverage |
|---|---|---|
| Future on Nifty 50 | 11.3% | 8.8:1 |
| Future on the rupee-dollar pair (USD/INR) | 2% | 50:1 |
| Future on the share of the example | 17.7% | 5.6:1 |
The margin rules of Indian exchanges set the margin each position needs (the broker may ask for more, never for less), and none of them stops a loss at the money in the account: a price gap can carry the loss on a derivative listed on an exchange past the margin deposited, and the client then owes the difference to the broker.
Trading in India is taxed on its gains under the Income-tax Act 2025, and no account shelters trading from tax.
No account in India shelters investments bought outright from tax, although long-term gains on listed shares and equity funds are exempt up to ₹125,000 a year.
An investor holds shares in a demat account, and two taxes can apply. Gains on selling shares and gains on derivatives listed on Indian exchanges are taxed differently under the Income-tax Act 2025. Dividends received are taxed under the ordinary income tax slabs, with 10% tax deducted at source (TDS). Buying shares also carries a Securities Transaction Tax (STT) of 0.1% of the value and a stamp duty of 0.015% on the purchase, and it reaches derivatives as well. The Income Tax Department sets these rules, and their effect depends on personal circumstances and can change.
The table below gives two routes to a market, compared on their form, the tax on their returns and the transaction taxes they carry.
| Route | Form | Tax | Transaction taxes |
|---|---|---|---|
| Demat account | Shares held outright | 20% short-term, 12.5% long-term above ₹125,000 a year, plus 4% cess; slab rates with 10% TDS | STT 0.1% and stamp duty 0.015% on a purchase for delivery |
| Derivatives of Indian exchanges | Contract listed on an exchange, sized in lots | Business income at the slab rates, up to 30% | STT 0.05% on the sale of a future, stamp duty 0.002% |
Owning for years and speculating are separated by the taxes of India. Speculating with derivatives listed on Indian exchanges is taxed on its gains under the Income-tax Act 2025.
What to check in a broker before trading online?
The seven checks to run on a broker before trading online are listed below.
- Authorisation: the firm is authorised by the regulator, appears on the regulator's public register, is absent from its warning list, and is not a clone using the name of an authorised firm. A firm that fails this check needs no further checks.
- Legal entity: the authorised company that will hold your account, named in the account agreement. International groups run several companies in different countries, and the protections you get are those of the company that holds your account.
- Client protections: client money kept segregated from the firm's own, negative balance protection for retail clients, and a compensation scheme that pays if the firm fails, never for trading losses.
- Products and markets: the route you need, buying outright, futures listed on an Indian exchange such as the National Stock Exchange of India, or both, on the markets you want to trade.
- Costs: the charges of a trade, spread, commission, the rollover of a future at expiry, which means paying the spread and the commission again on the next contract, and currency conversion, read in the firm's own price list rather than in its adverts.
- Platform and app: the tools you will use for every order, which have to be stable, clear and quick, and which you should try before deciding which trading platform is best for the way you trade.
- Demo account: the main Indian brokers offer no demo with virtual money and live prices (as the help pages of Zerodha, Fyers and Dhan state), so ask the broker whether it has a demo version of its platform with test data, or practise on the paper trading of an external platform, before any money is at stake. Indian rules stop exchanges and brokers from sharing live prices with virtual trading platforms, so an app that promises virtual trading on live prices, or cash prizes, is one to avoid.
The order of the checks matters, because a firm that fails the first one is not worth assessing on costs or apps. Once several firms pass the first three checks, comparing brokers on the last four, side by side, shows which one fits the market and the route you have chosen.
Should trading be practised on a demo account first?
Yes, trading should be practised on a demo first, with no real money at stake, so a beginner learns orders, position sizing, stops and costs for free. The main Indian brokers offer no demo account with virtual money and live prices (as the help pages of Zerodha, Fyers and Dhan state): practice runs on a demo version of the broker's platform with test data, where the broker has one, or on the paper trading of an external platform, and an app that promises virtual trading on live prices, or cash prizes, is one to avoid, because Indian rules stop exchanges and brokers from sharing live prices with such platforms. A demo teaches the mechanics and not the discipline, because no real money is at stake, so the trader makes the move to real money at small size.
A demo account teaches everything done on the practice tool, the demo version of the broker's platform or an external platform: placing a market order and a limit order, attaching a stop-loss and a target, sizing a position to a set risk, and watching the spread come off the result and, where the practice tool allows it, rolling a position over to the next contract before expiry. A mistake made on a demo costs nothing.
What a demo lacks is the pressure of real money. Fear and greed are absent when the money is virtual, so a trader who follows the plan on a demo may break it with real money. Fills on a demo are often cleaner than live fills, without the slippage of a real market, and demo balances are often far larger than the real money the trader will use, which teaches position sizes a live account cannot carry.
The move from demo to real money needs a plan. Log a run of demo trades, for example 50, with the reason, the risk and the result of each. Set the demo balance to the amount you will trade with real money. Practise on the same market and with the same stake you plan for the live account. A logged run on a realistic balance is what demo trading involves when the aim is to learn, and the first live trades then repeat it at small size.
Can a beginner start trading online?
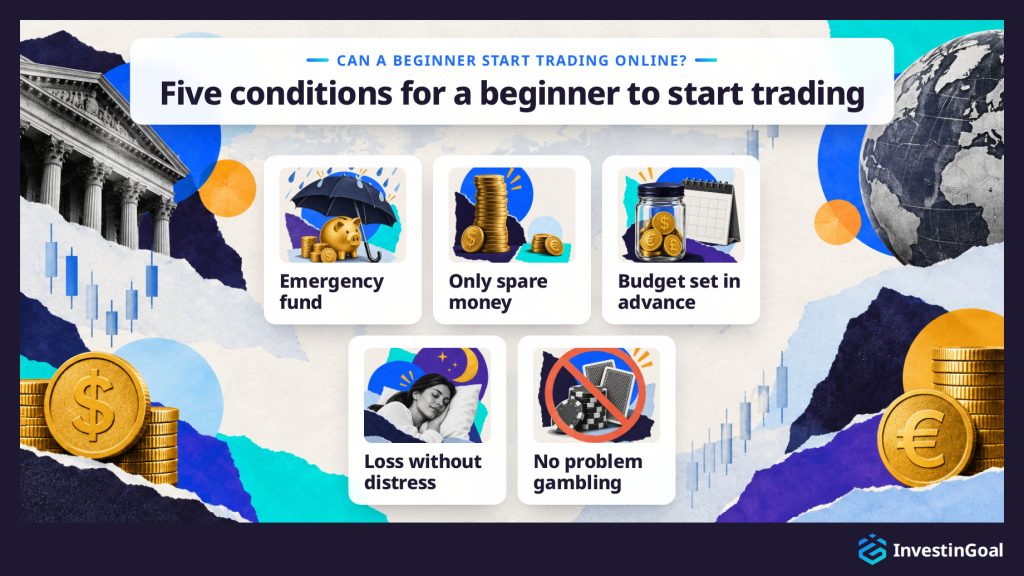
Yes, a beginner can start trading online, on a demo account first and not with real money until the basics are solid. The beginner then places the first trades with real money at small size. The conditions for starting are an emergency fund in place, only money that is truly spare, a budget set in advance, the ability to lose that budget without real distress, and no history of problem gambling.
The conditions come before any technique because most retail accounts that trade CFDs lose money, as the firms' own published figures show. An emergency fund in place means that a loss in trading never touches the money for rent, bills or an unexpected expense. Money that is truly spare is money you can afford to lose, because you would not miss it. The budget is the cap on what you may lose, decided before the first deposit and not raised after a loss. Losing the budget without real distress is the test of its size. A budget whose loss would cause sleepless nights is too large for your risk tolerance.
A history of problem gambling is a reason to stay away. Trading is not gambling by design, but for someone with that history it can trigger the same behaviour. The patience to practise first means time on a demo account before any real money, because an adult who passes the broker's identity checks can open an account in minutes, long before being ready to use it. For a beginner who meets the conditions, the plan runs from learning the mechanics to practising on a demo and then to a first trade placed at small size, the sequence at the heart of how to start trading online.
The practical questions of a beginner's first stage are answered below: how little money is enough, how a first trade is set up, who may open an account, how trading compares with gambling, and the mistakes and myths that cost beginners most.
Yes, it is possible to start trading with little money, but not with just any amount, because a future on an Indian exchange trades in whole lots and the minimum is the margin of one lot, which the exchange sets through NSE Clearing: about ₹1,900 for one lot of the USD/INR currency future and about ₹1,69,700 for one lot of the future on the Nifty 50. The budget is the most you accept to lose, and at a risk of 1% per trade an account of ₹13,000 risks ₹130 on each trade and an account of ₹65,000 risks ₹650.
The right amount is decided by the budget, not by the broker's minimum deposit. The budget is the sum you can lose entirely without real distress, after the emergency fund is in place, and it has to cover at least the margin of one lot. A future cannot be traded in less than one lot, so the position size follows from the stop only in whole lots: when one lot, with the stop where the reason for the trade no longer holds, risks more than 1% of the account, the account is too small for that trade.
At ₹130 of risk per trade, the gains are small too, and the temptation is to raise the leverage to make the account grow faster, which turns a small budget into a fast loss. The risk per trade stays the same fraction of the account whatever the size of the account.
A demo account costs nothing, so the practice that comes before the first deposit needs no money at all.
The seven steps that set up a first trade are listed below.
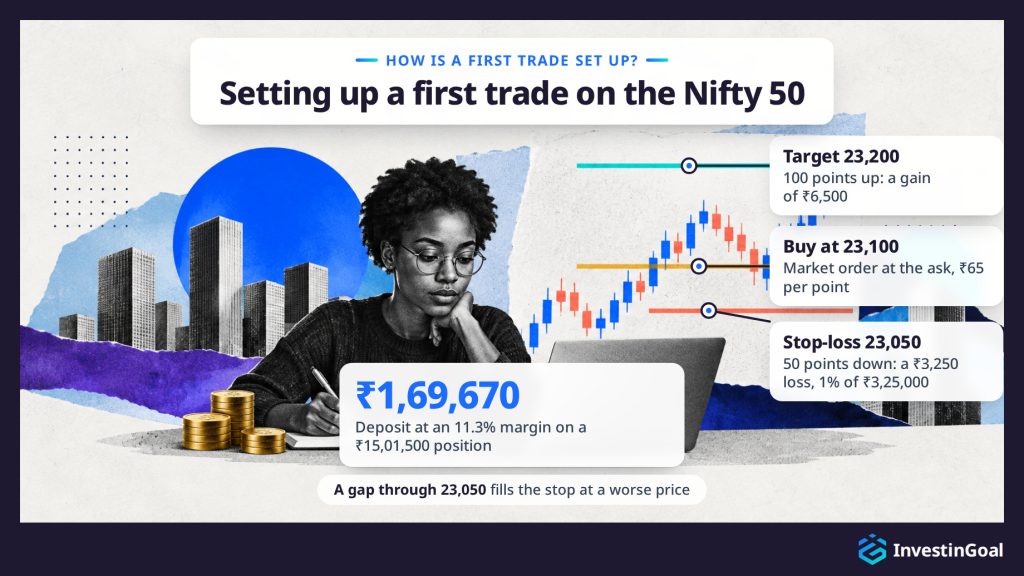
- Pick the market and the reason: choose one liquid market and write down why you expect it to move. In the example, the market is a future on the Nifty 50 listed on the National Stock Exchange of India, quoted at 23,098 / 23,100, with the size of the lot and the margin set by the exchange, the reason is a view that the index will rise, and the account holds ₹3,25,000 of money that is truly spare.
- Decide the risk: fix the most the trade may lose before anything else. At 1% of the account, the risk is ₹3,250.
- Set the stop-loss and the target: place the exit where the reason no longer holds, and the target at least twice as far from the entry. The stop-loss goes at 23,050, 50 points below the entry price of 23,100, and the target at 23,200, 100 points above it.
- Size the position: divide the risk by what the distance to the stop costs on one lot, which gives the number of lots. ₹3,250 ÷ ₹3,250, the cost of 50 points on one lot, gives one lot, with a value of ₹65 per point, a position worth ₹15,01,500 with the index at 23,100, and at the margin that the exchange sets for the future through NSE Clearing, 11.3% (8.8:1), the deposit is ₹1,69,670.
- Place the order: buy with a market order, which fills at the ask of 23,100, and attach the stop-loss and the take-profit to it. The position opens 2 points down, ₹130, because it would close at the bid of 23,098. The spread is inside both results, since the trade opens at the ask and closes at the bid.
- Manage and close: leave the orders to work and do not move the stop-loss. If the bid reaches the target of 23,200, the position closes 100 points up, a gain of ₹6,500. If the bid reaches the stop of 23,050, the position closes 50 points down, a loss of ₹3,250, the risk decided first. Held overnight, a future pays no financing, because the cost of holding the position is built into its price, and a position kept past the expiry of the contract has to be rolled over to the next one. A gap through 23,050 fills the stop at a worse price, and the loss then exceeds ₹3,250.
- Record the trade: write down the reason, the risk, the entry, the exit, the result, the costs and any rule you broke, before the next trade.
Yes, online trading is open to any adult who passes the broker's checks. The checks are proof of identity and address, the age of majority, and, where the regulator of the broker's company requires it, an appropriateness test before leveraged products. Trading one's own money needs no licence.
The identity and address checks are a legal requirement against fraud and money laundering, met with an identity document and a recent proof of address. The appropriateness test, where the regulator of the broker's company requires it, asks about your knowledge and experience of leveraged products before the broker lets you trade them, and a broker that judges a product not appropriate for you has to warn you. The same checks apply to a student, who can open an account like any other adult.
In India, a person who trades their own money needs no licence, and the broker runs the checks that the regulator of its company requires before leveraged products.
No, trading is not like gambling by design, because a trade has a known cost, the spread, and a loss capped by position size and a stop-loss, while a bet faces odds set by a bookmaker. Without a tested method, a fixed risk and costs under control, trading behaves like gambling.
A bookmaker sets the odds of a bet so that the bookmaker profits across all bets, and the bettor loses the whole stake on a losing bet. A trade's cost is the spread, and the trader knows that cost before placing the order and sets the loss through the position size and the stop-loss. Over many trades, a tested method and a risk fixed in advance give the result a structure that a bet does not have.
A trader who enters on a hunch, raises the size after a loss and ignores the costs is placing bets through a trading platform.
Binary options are the trading product most often compared to gambling. Binary options work like a bet and are banned for retail clients in many countries, the UK included.
For someone with a history of problem gambling, trading can trigger the same behaviour, the chase of a loss and the pull of the next position, and that history is a reason to stay away from trading altogether.
The six common trading mistakes are listed below.
- Overtrading: opening positions without a real reason, out of boredom or the wish to be in the market, so that costs pile up and each decision gets less thought.
- Chasing losses: raising the size to win back a loss, which turns one losing trade into a larger loss.
- Moving the stop-loss: widening the stop as the price approaches it, so that the loss decided before the trade grows into one the trader never planned.
- Abandoning the plan: dropping the rules after one loss or a short losing run, when a run of losses is a normal part of any method.
- Ignoring costs: watching the price move and not the spread, the commission and the cost of rolling a future over at each expiry, that is, the spread and the commission paid again, which decide whether a small gain is a gain at all.
- Skipping the record: trading without writing anything down, which leaves no way to learn what works and what does not.
The five steps of a trading performance review are listed below.
- Log every trade: write down the setup, the plan, the result, the costs and any rule broken in a trading journal, at the moment the trade closes.
- Review weekly: read the week's trades together, on a fixed day, away from the hours the market is open.
- Read the figures: calculate the win rate, the average win against the average loss, the costs paid and the number of rule breaks.
- Change one rule at a time: adjust the distance of the stop, or the market traded, so that the following weeks show its effect.
- Judge on many trades: draw conclusions from dozens of trades, not from one week, because past results describe what happened and do not predict what comes next.
The six common myths about trading are listed below.
- The 90-90-90 rule: the claim that 90% of new traders lose 90% of their money in 90 days has no source behind it. The measured figure is the share of retail accounts that lose money, which firms offering CFDs in the UK and the European Union publish and update every quarter.
- Trading as a salary: a salary arrives every month, and trading results do not. Losing months are part of every method, while the trader pays the costs of trading and of living in all of them.
- Winning most trades: profit does not require being right most of the time. A trader who wins 40% of trades can be profitable if the wins are larger than the losses: with wins twice the size of the losses, four wins in ten leave the account ahead before costs.
- More trades, more profit: the evidence points the other way. Barber and Odean found that the households that traded most earned the least, because each extra trade added costs and few added returns.
- Past results as proof: a run of winning trades, a strategy's record or a screenshot of someone else's profits does not show what the next trades will do. Past performance is not a reliable indicator of future results.
- Leverage as extra money: leverage is exposure, not money. A deposit of ₹65,000 at 20:1 controls a position of ₹13,00,000, and the loss on that position is the trader's own.